Wazuh
Wazuh is a free and open source security platform that unifies XDR and SIEM capabilities. It protects workloads across on-premises, virtualized, containerized, and cloud-based environments.
Wazuh helps organizations and individuals to protect their data assets against security threats. It is widely used by thousands of organizations worldwide, from small businesses to large enterprises.
- Enabling Docker Listerner in Wazuh
- Docker container security monitoring with Wazuh
- Wazuh Agent Deployment & Troubleshooting Guide
- 🛠️ Fixing Wazuh Dashboard Migration Loops
- 🛠️ Breaking the Migration Lockge
- 📜 Clean Dashboard Log Viewing
- 🛠️ Wazuh Logs Advanced Log Troubleshooting (with JQ)
- 📡 Fixing Disconnected Agents
Enabling Docker Listerner in Wazuh
To Enable Docker Listener in Wazuh
To maintain the security and compliance of your Docker environment, it is crucial to proactively monitor both your Docker server and containers. The Docker server is the backbone of your container infrastructure and manages the deployment of containers and resource allocation. By monitoring the Docker server, you can keep track of resource usage, unauthorized access attempts, performance issues, and other security concerns.
However, it is not enough to monitor only the Docker server, you also need to monitor the containers themselves. Container monitoring provides insight into the activities of your containers, such as network connections, file system changes, and process executions. Monitoring these activities helps to detect suspicious behavior, identify malware or malicious processes, and respond to security incidents in real-time.
By monitoring both the Docker server and the containers, you can proactively detect and respond to security threats, ensuring the security and compliance of your Docker environment to regulatory standards.
Wazuh agent configuration
1. Install the dependencies on the docker server :
Run each line Separately
sudo apt-get update && sudo apt-get install python3 -y
sudo apt-get install python3-pip -y
pip3 install docker==4.2.0 urllib3==1.26.18
2. Edit the File using sudo nano /var/ossec/etc/ossec.conf and add the following:
<!-- Docker Container Runtime configuration -->
<wodle name="docker-listener">
  <interval>10m</interval>
  <attempts>5</attempts>
  <run_on_start>yes</run_on_start>
  <disabled>no</disabled>
</wodle>
3. To monitor the logs of the container add the text below to the "<!-- Log analysis -->" section:
<localfile>
  <log_format>syslog</log_format>
  <location>/var/lib/docker/containers/*/*-json.log</location>
</localfile>
4. Restart the wazuh-agent service:
sudo systemctl restart wazuh-agentWazuh server configuration
1. Edit the Decoder File in /var/ossec/etc/decoders/local_decoder.xml on the Wazuh Server and add:
 <decoder name="web-accesslog-docker">
  <parent>json</parent>
  <type>web-log</type>
  <use_own_name>true</use_own_name>
  <prematch offset="after_parent">^log":"\S+ \S+ \S+ \.*[\S+ \S\d+] \.*"\w+ \S+ HTTP\S+" \d+</prematch>
  <regex offset="after_parent">^log":"(\S+) \S+ \S+ \.*[\S+ \S\d+] \.*"(\w+) (\S+) HTTP\S+" (\d+)</regex>
  <order>srcip,protocol,url,id</order>
</decoder>

<decoder name="json">
  <parent>json</parent>
  <use_own_name>true</use_own_name>
  <plugin_decoder>JSON_Decoder</plugin_decoder>
</decoder>
2.Restart the Wazuh-Manager:
sudo systemctl restart wazuh-managerWazuh Docker listener dashboard
The Wazuh Docker listener dashboard offers a centralized and user-friendly interface that allows you to monitor the security of your Dockerized infrastructure. With real-time insights and actionable information, the Wazuh Docker listener dashboard empowers system administrators and security teams to detect and respond to potential threats, ensuring the integrity and reliability of containerized applications. From monitoring container events to analyzing logs and implementing custom rules, this dashboard streamlines the security management process, enhancing the overall protection of your Docker environment.
Take the following steps to enable the Wazuh Docker listener dashboard:
-
Click on the Wazuh menu icon, and select Settings > Modules.
-
Scroll down to the Threat Detection and Response section and enable Docker listener.
-
Click on the Wazuh menu icon, and select Modules > Docker listener to view the Docker listener dashboard.
The animation below is a graphical representation of the steps you need to take to enable the Wazuh Docker listener dashboard.
Wazuh Docker listener configuration options
In this section, we provide more information about the Wazuh Docker listener and all possible configuration options. The Docker listener has the main options and the scheduling options.
Main options
The main options allow you to enable or disable the Docker listener, and to configure the number of attempts to rerun the listener in case it fails. The two main options are disabled and attempts.
disabled
The disabled option allows you to enable or disable the Docker listener.
|
Default value |
no |
|
Allowed values |
yes, no |
attempts
The attempts option specifies the number of attempts to execute the listener in case it fails.
|
Default value |
5 |
|
Allowed values |
A positive number |
Scheduling options
The scheduling options allow you to configure when the Docker listener should execute. The available scheduling options are run_on_start, interval, day, wday, and time. The Docker listener runs on start by default when enabled without any scheduling options.
run_on_start
Run the Docker listener immediately when the Wazuh agent starts.
|
Default value |
yes |
|
Allowed values |
yes, no |
interval
Waiting time to rerun the Docker listener in case it fails.
|
Default value |
1m |
|
Allowed values |
A positive number that should contain a suffix character indicating a time unit, such as s (seconds), m (minutes), h (hours), d (days), M (months). |
day
Day of the month to run the scan.
|
Default value |
n/a |
|
Allowed values |
Day of the month [1..31] |
Note
When the day option is set, the interval value must be a multiple of months. By default, the interval is set to a month.
wday
Day of the week to run the scan. This option is not compatible with the day option.
|
Default value |
n/a |
|
Allowed values |
Day of the week:
|
Note
When the wday option is set, the interval value must be a multiple of weeks. By default, the interval is set to a week.
time
Time of the day to run the scan. It has to be represented in the format hh:mm.
|
Default value |
n/a |
|
Allowed values |
Time of day [hh:mm] |
Note
When only the time option is set, the interval value must be a multiple of days or weeks. By default, the interval is set to a day.
Example configuration
The example configuration below shows an enabled Docker listener. The listener attempts to execute five times at ten-minute intervals if it fails
<wodle name="docker-listener">
  <interval>10m</interval>
  <attempts>5</attempts>
  <run_on_start>no</run_on_start>
  <disabled>no</disabled>
</wodle>
Docker container security monitoring with Wazuh
Docker has become a popular framework for application deployment since its development due to its benefits. For example, it makes it easier for organizations to enhance the portability of their applications and operational resilience. Docker is an open source technology used to package applications into containers. Docker containers are lightweight, standalone, and runnable instances of a Docker image that isolate software running in the container from the operating system environment. With these benefits, many organizations have adopted the technology to quickly package their software in standard units for development, shipment, and deployment.
The increased usage of containerized software has increased the attack surface for organizations. This provides an additional asset for cyber threat actors to target in their attacks. Therefore, it is crucial to continuously monitor containers to gain complete visibility of their environment and events during execution.
In this blog post, we demonstrate how to do the following:
- Monitor Docker events such as
pull,create,start,mount,connect,exec_start,detach,die,exec_create,exec_detach, etc. - Monitor Docker container resources such as CPU, memory, and network traffic utilization.
- Detect when container CPU and memory usage exceed predefined thresholds.
- Monitor the health status and uptime of Docker containers.
Docker Container: Infrastructure setup
The following setup is used to illustrate the capability of Wazuh to monitor Docker container events and their metrics:
- A Centos 7 endpoint running the Wazuh 4.3.10. The Wazuh central components can be installed using this Quickstart installation guide.
- An Ubuntu 22.04 endpoint running the Wazuh agent 4.3.10. This endpoint also hosts the Docker container infrastructure. This Wazuh guide is used to install the Wazuh agent.
Monitoring with Wazuh
Wazuh has the Docker listener and command monitoring modules that can be used to collect security and runtime events from Docker containers. The Docker listener module communicates with the Docker API to collect events related to Docker containers. The command monitoring module is used to monitor the output of specific commands and trigger alerts if they match a rule.
Ubuntu endpoint configuration
Follow these steps on the monitored endpoint:
Note
You need root user privileges to execute all the commands described below.
1. Install Python and pip:
2. Install Docker and the Python Docker Library to run the containers:
3. Enable the Wazuh agent to receive remote commands from the Wazuh server. By default, remote commands are disabled in agents for security reasons.
4. Restart the Wazuh agent to apply the above changes:
Wazuh server configuration
Follow these steps on the Wazuh server:
Note
You need root user privileges to execute all the commands described below.
1. Create a Wazuh agent group called container:
2. Obtain the ID of all Wazuh agents using the following command:
3. Assign the Wazuh agent hosting the Docker containers to the container group. Multiple agents can be assigned to the group. This ensures all agents running Docker containers in your environment receive the same configuration.
Replace <AGENT_ID> with the agent’s ID of the endpoint hosting the Docker container.
4. Add the following settings to the /var/ossec/etc/shared/container/agent.conf configuration file. This enables the Docker listener module and sets the commands to execute on the monitored endpoint for Docker container information gathering.
Note
The <frequency> tag defines how often the command will be run in seconds. You can configure a value that suits your environment.
The commands to extract information configured above can get logs like in the following samples:
- Log for container resources:
- Log for container health:
5. Create a decoders file docker_decoders.xml in the /var/ossec/etc/decoders/ directory and add the following decoders to decode the logs received from the Wazuh agent:
Note
The custom decoder file docker_decoders.xml might be removed during an upgrade. Ensure to back up the file before you perform upgrades.
6. Create a rules file docker_rules.xml in the /var/ossec/etc/rules/ directory and add the following rules to alert the container information:
Note
The custom rules file docker_rules.xml might be removed during an upgrade. Ensure to back up the file before you perform upgrades.
7. Restart the Wazuh manager to apply the above changes:
Testing the configuration
To showcase the use cases mentioned above, Nginx, Redis, and Postgres images are used to create a containerized environment on the monitored endpoint.
1. Create and switch into a project directory /container_env for the container environment using the following command:
2. Create a Docker compose file docker-compose.yml and add the following configurations to it. The Docker compose file helps to manage multiple containers at once. The configuration performs the following Docker actions:
- Pulls Nginx, Redis, and Postgres container images from Docker Hub.
- Creates and starts
nginx-container,redis-container, andpostgres-containercontainers from the respective Docker images. - Creates and connects to a network called
container_env_network. - Creates and mounts volumes
container_env_dbandcontainer_env_cache. - Performs health checks on the created containers every three minutes.
3. Execute the following command in the path containing the docker-compose.yml file to create and start the containers:
4. we use the stress-ng utility program to test for high CPU and memory utilization. Perform this test on one of the containers, for instance, the nginx-container.
- Execute the following commands to enter the container shell and install the stress-ng utility:
- Execute the following command to trigger a high-level alert when both CPU and memory utilization exceeds 80%. The command runs for 3 minutes.
- Execute the following command to trigger a high-level alert when memory usage exceeds 80%. The command runs for 3 minutes.
- Execute the following command to trigger a high-level alert when CPU usage exceeds 80%. The command runs for 3 minutes.
5. The health check for the nginx-container verifies whether the configuration file /etc/nginx/nginx.conf exists. While inside the container shell, delete the configuration file to trigger a high-level alert when the container becomes unhealthy:
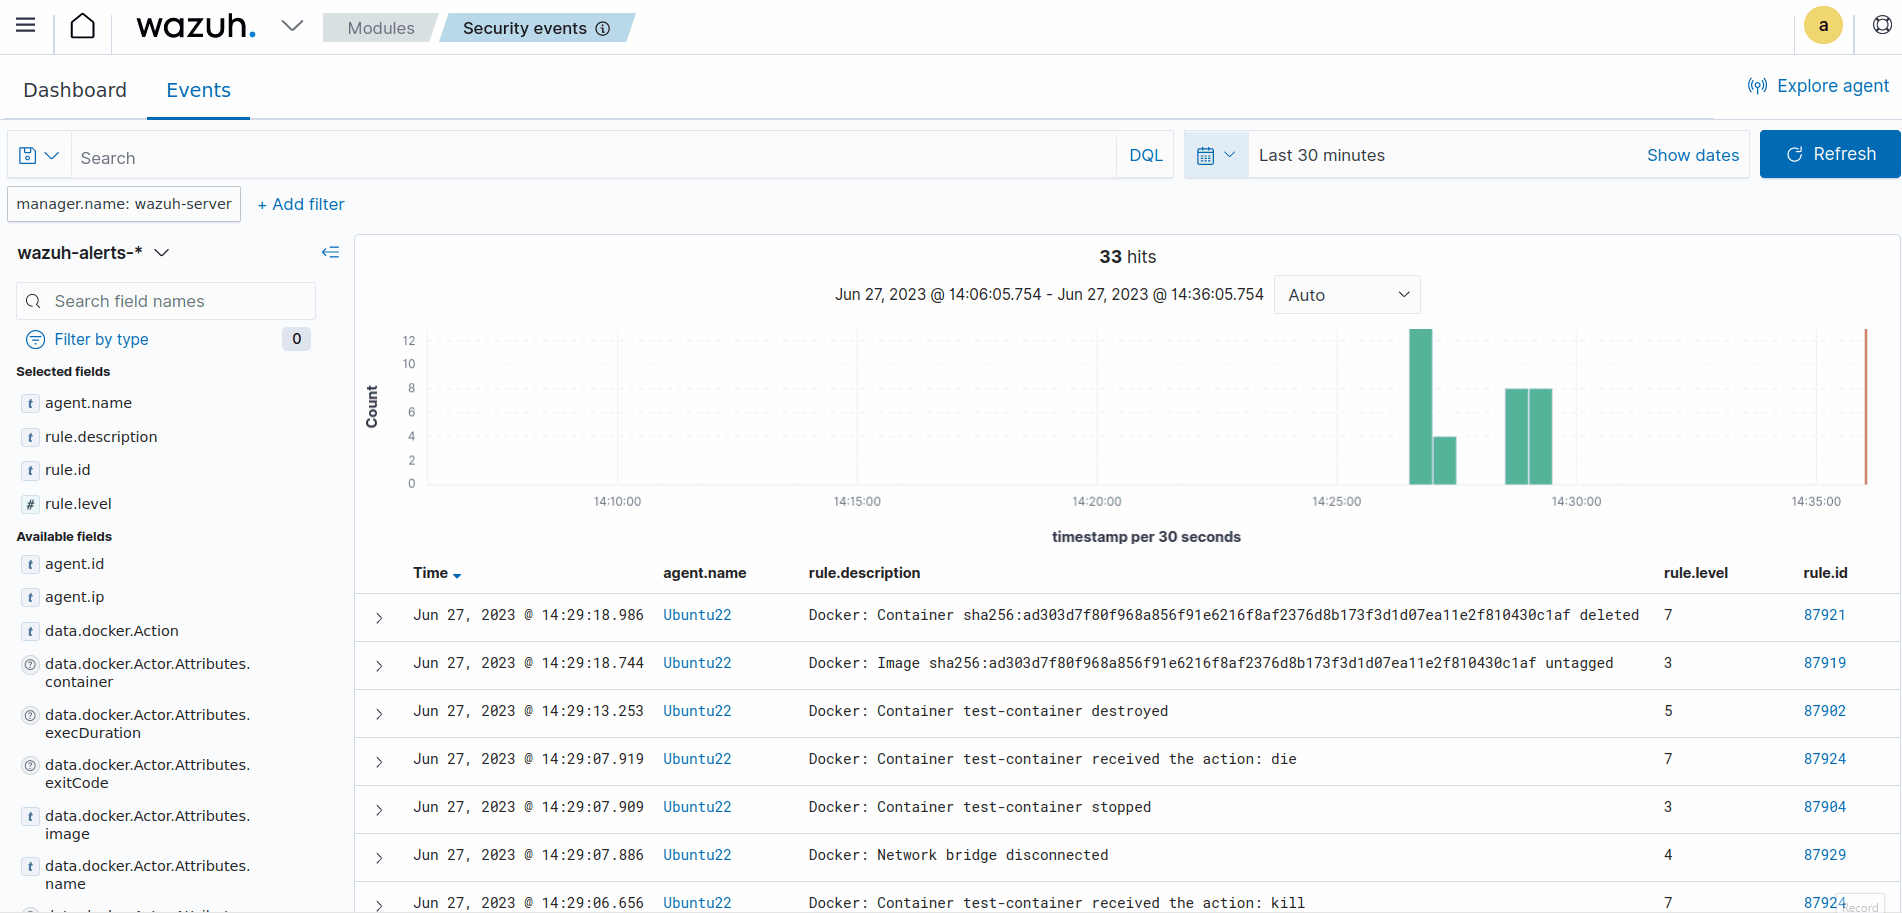
Alert visualization
Visualize the triggered alerts by visiting the Wazuh dashboard.
- Container actions alerts: Navigate to the Discover section and add the
rule.groups: dockerfilter in the search bar to query the alerts. Also, use the Filter by type search field and apply theagent.name,data.docker.from,data.docker.Actor.Attributes.name,data.docker.Type,data.docker.Action, andrule.description, filters. Save the query as Docker Events.
- Container resources alerts: Navigate to the Discover section and add the
rule.id: (100100 OR 100101 OR 100102 OR 100103)filter in the search bar to query the alerts. Also, use the Filter by type search field and apply theagent.name,data.container_name,data.container_cpu_usage,data.container_memory_usage,data.container_memory_limit,data.container_network_rx, anddata.container_network_txfilters. Save the query as Container Resources.

- Container health alerts: Navigate to the Discover section and add the
rule.id: (100105 OR 100106)filter in the search bar to query the alerts. Also, use the Filter by type search field and apply theagent.name,data.container_image,data.container_name,data.container_health_status, anddata.container_uptimefilters to show the status information. Save the query as Container Health.

- Container threshold events: Navigate to the Wazuh > Security events section and add the
rule.id: (100101 OR 100102 OR 100103 OR 100106)filter in the search bar to query the alerts.

To have a single display of the visualizations, create a custom dashboard with the above templates. Navigate to OpenSearch Dashboards > Dashboard > Create New Dashboard, then select Add an existing link and click the saved visualizations (Docker Events, Container Resources, and Container Health). This will add the visualizations to the new dashboard. Save the dashboard as Container-resource-health-events.

Conclusion
High visibility of containers in Dockerized environments allows you to maintain a secure and efficient environment. This way, organizations can quickly identify and respond to issues and minimize disruptions. With Wazuh, we can spot abnormalities in containers, get an overview of their resource utilization, and easily analyze their health.
In this blog post, we ensured complete coverage of our Dockerized environment by monitoring Docker container events, resource utilization, and health to improve overall security.
References
- Monitoring Docker container events.
- Docker reference documentation.
- Creating Wazuh decoders and rules from scratch.
Wazuh Agent Deployment & Troubleshooting Guide
This guide documents the procedures for maintaining Wazuh agents on Ubuntu 22.04/24.04, with specific instructions for Docker monitoring and manual ID preservation.
1. Agent Version Control (Critical)
Constraint: The Wazuh Manager version must always be equal to or higher than the Agent version.
- Manager Version: v4.9.0
- Target Agent Version: v4.9.0
# Download the specific matching version
wget https://packages.wazuh.com/4.x/apt/pool/main/w/wazuh-agent/wazuh-agent_4.9.0-1_amd64.deb
sudo dpkg -i wazuh-agent_4.9.0-1_amd64.deb
2. Preserving Existing Agent IDs (e.g., ID 015)
Use this process when reinstalling an agent to ensure it keeps its historical data and ID.
Step A: Extract Key from Manager
Run this on the Wazuh Manager terminal:
sudo /var/ossec/bin/manage_agents -e 015Copy the long alphanumeric string provided.
Step B: Import Key to Agent
Run this on the Bookstack-LXC terminal:
sudo /var/ossec/bin/manage_agents -i [PASTE_KEY_HERE]3. Monitoring Authentik & Docker Containers
To populate the Docker dashboard and monitor Authentik logs, three components are required.
Step A: Python Dependencies (Ubuntu 24.04 Fix)
Ubuntu 24.04 prevents global pip installs by default. Use --break-system-packages to allow the agent's internal scripts to run.
sudo apt update && sudo apt install python3-pip -y
pip3 install docker==7.1.0 requests==2.32.2 --break-system-packages
sudo usermod -aG docker wazuh
Step B: Config Changes (ossec.conf)
Open /var/ossec/etc/ossec.conf and add these blocks before the final </ossec_config>.
<!-- Monitor Container Events (Starts/Stops) -->
<wodle name="docker-listener">
  <interval>1m</interval>
  <attempts>5</attempts>
  <run_on_start>yes</run_on_start>
  <disabled>no</disabled>
</wodle>

<!-- Monitor Authentik Container Logs -->
<localfile>
  <log_format>syslog</log_format>
  <location>/var/lib/docker/containers/*/*-json.log</location>
</localfile>
4. Troubleshooting Checklist
| Error in ossec.log | Fix Action |
|---|---|
| Invalid server address: 'MANAGER_IP' | Update <address> in ossec.conf to wazuh.msls.tech. |
| Error reading XML file (line 0) | Check for nested or unclosed <ossec_config> tags. |
Handling Duplicate Agents for the Same VM
If a VM appears twice (e.g., with two different IDs), follow these steps to keep the ID with historical data:
- Identify: Find the ID you want to keep (ID_KEEP) and the one to delete (ID_DEL).
- Delete on Manager:
sudo /var/ossec/bin/manage_agents -r [ID_DEL]. - Stop Agent Service:
sudo systemctl stop wazuh-agenton the VM. - Refresh Key: Extract the key for ID_KEEP from the manager (
-e) and import it to the agent (-i). - Restart:
sudo systemctl restart wazuh-agent.
🛠️ Fixing Wazuh Dashboard Migration Loops
If you keep seeing “Wazuh dashboard server is not ready yet” in a loop, the Wazuh Dashboard is almost always stuck on a migration lock. This typically happens after an interrupted upgrade or restart.
🔐 Security Warning
Never store real credentials in documentation. If a password was previously exposed on this page, rotate it immediately.
📋 Overview
- Symptom: Dashboard never finishes loading
- Root cause: Stuck
.kibanamigration index - Fix: Remove the corrupted index and allow a clean rebuild
① Stop the Wazuh Dashboard
Stop the service to ensure no active writes occur during cleanup.
sudo systemctl stop wazuh-dashboard② Remove the stuck Kibana index
This deletes the partially migrated UI index that causes the loop.
⚠️ Impact
- Saved dashboards and visualizations may be reset
- Wazuh alerts and event data are not removed
Option A — Simple (placeholder password)
curl -k -u admin:'<PASSWORD>' -X DELETE "https://localhost:9200/.kibana*"Option B — Recommended (secure password prompt)
read -s -p "Password: " WAZUH_PASS; echo
curl -k -u "admin:${WAZUH_PASS}" -X DELETE "https://localhost:9200/.kibana*"
unset WAZUH_PASS
🛠️ Breaking the Migration Lockge
The "Another process is migrating" error occurs when the dashboard service is interrupted while recreating its internal indices. Follow these steps in exact order to clear the lock.
Stop the Dashboard Service
You must stop the service to ensure no active processes are attempting to write to the index during the cleanup.
sudo systemctl stop wazuh-dashboardClear the Stuck System Index
This removes the "half-finished" index that is causing the resource_already_exists_exception and migration lock.
curl -k -u admin:'<password>' -X DELETE https://localhost:9200/.kibana*Start and Allow Initialization
Restart the service. The dashboard will now see that the index is missing and recreate it cleanly.
sudo systemctl start wazuh-dashboard
⚠️ The "5-Minute Rule"
📜 Clean Dashboard Log Viewing
The default dashboard logs are dense JSON strings. Use these filtered commands to see exactly what is happening during a migration without the "noise".
Filter for Migration Progress
This command hides the repetitive warnings and only shows messages related to the index migration and server status.
sudo journalctl -u wazuh-dashboard -f | grep -iE "migration|savedobjects|server running"Pretty-Print with JQ
If you have jq installed, this command parses the JSON into a structured, readable format with timestamps.
sudo journalctl -u wazuh-dashboard -f | grep --line-buffered "{" | jq '.'The "Finish Line" Message
Regardless of the format, you are looking for this specific log entry. Once you see it, the migration is complete.
💡 Installing JQ
If the jq command is not found, install it with: sudo apt update && sudo apt install jq -y
🛠️ Wazuh Logs Advanced Log Troubleshooting (with JQ)
The Wazuh Dashboard logs are JSON-formatted, but standard journalctl prepends timestamps that break JSON parsers. Use these commands to see perfectly formatted, readable logs.
View Pretty-Printed JSON
The -o cat flag removes the OS timestamps, allowing jq to parse the dashboard's internal JSON correctly.
sudo journalctl -u wazuh-dashboard -o cat -f | jq '.'Extract Only Timestamps and Messages
If you want a very clean list of just the time and the action being performed, use this jq filter.
sudo journalctl -u wazuh-dashboard -o cat -f | jq -r '"[\(."@timestamp")] \( .message)"'Handling Non-JSON Errors
Sometimes the system outputs non-JSON errors (like service start failures). If the commands above fail, fall back to the raw log.
sudo journalctl -u wazuh-dashboard -e --no-pager✅ Resulting Output
By using -o cat, you ensure that every line passed to jq starts with {, eliminating the parse error you encountered.
📡 Fixing Disconnected Agents
When an agent shows as Disconnected, it is usually due to a service failure on the endpoint or a network/firewall block between the endpoint and the Wazuh Manager.
Restart Service on Hestia VM
Log into the Hestia VM and restart the agent. This often restores the connection after a server-side outage.
sudo systemctl restart wazuh-agentVerify Connection Status
Check the agent logs on the Hestia VM to see if it is successfully "handshaking" with the Manager.
sudo tail -f /var/ossec/logs/ossec.log | grep -iE "error|warn|connected"Test Connectivity to Port 1514
Wazuh agents communicate via TCP Port 1514. Run this from the Hestia VM to ensure the port is open on the SIEM server.
# Replace with your Wazuh Manager IP
nc -zv wazuh.msls.tech 1514
⚠️ Connection Issues in Oracle Cloud
Since Hestia is in Oracle Cloud, ensure your VCN Ingress Rules and the OS Firewall (ufw/iptables) on both sides allow traffic on Port 1514.